The governance control plane for your telemetry.
CerbiShield gives platform engineering, security, and compliance teams a single place to define governance policies, deploy rule sets to environments, investigate violations, and produce audit-ready reports - all within your own infrastructure.
Everything in one place
CerbiShield is not an add-on - it is the control plane that makes governance observable, auditable, and manageable at scale.
Governance Rules
Define required fields, forbidden patterns, and sensitive field categories through a visual editor or JSON interface.
Pre-deployment Validation
Test governance policies against real log payloads before they reach production. Field-level feedback included.
Rule Deployment Tracking
Full audit trail of which rule versions are active in which environments, and who deployed them.
Violations Explorer
Drill into governance violations by environment, application, rule, or severity. Identify patterns and remediate.
Compliance Reporting
Governance score trends, enforcement health, and exportable audit reports for compliance reviews.
Audit Log
Immutable record of every rule change, deployment, and administrative action in your governance system.
RBAC
Separate rule creation, deployment, and compliance review across engineering, operations, and security teams.
Entra SSO
Enterprise single sign-on via Microsoft Entra ID. No standalone identity management required.
Tenant-Hosted
CerbiShield runs inside your infrastructure. Log payloads and telemetry never leave your environment.
Governance Profiles
Versioned JSON profiles that live in your repositories, reviewed and promoted like application code.
Platform Health
Monitor CerbiShield service uptime, latency, and throughput in real time from a single pane.
Role-Aware Views
Each role sees the dashboard tailored to their responsibilities - no noise, no missing context.
Runs entirely in your tenant
CerbiShield is deployed within your infrastructure - not as a shared SaaS service. Log payloads, governance metadata, and telemetry signals never leave your environment. Cerbi does not process or own your log data pipelines.
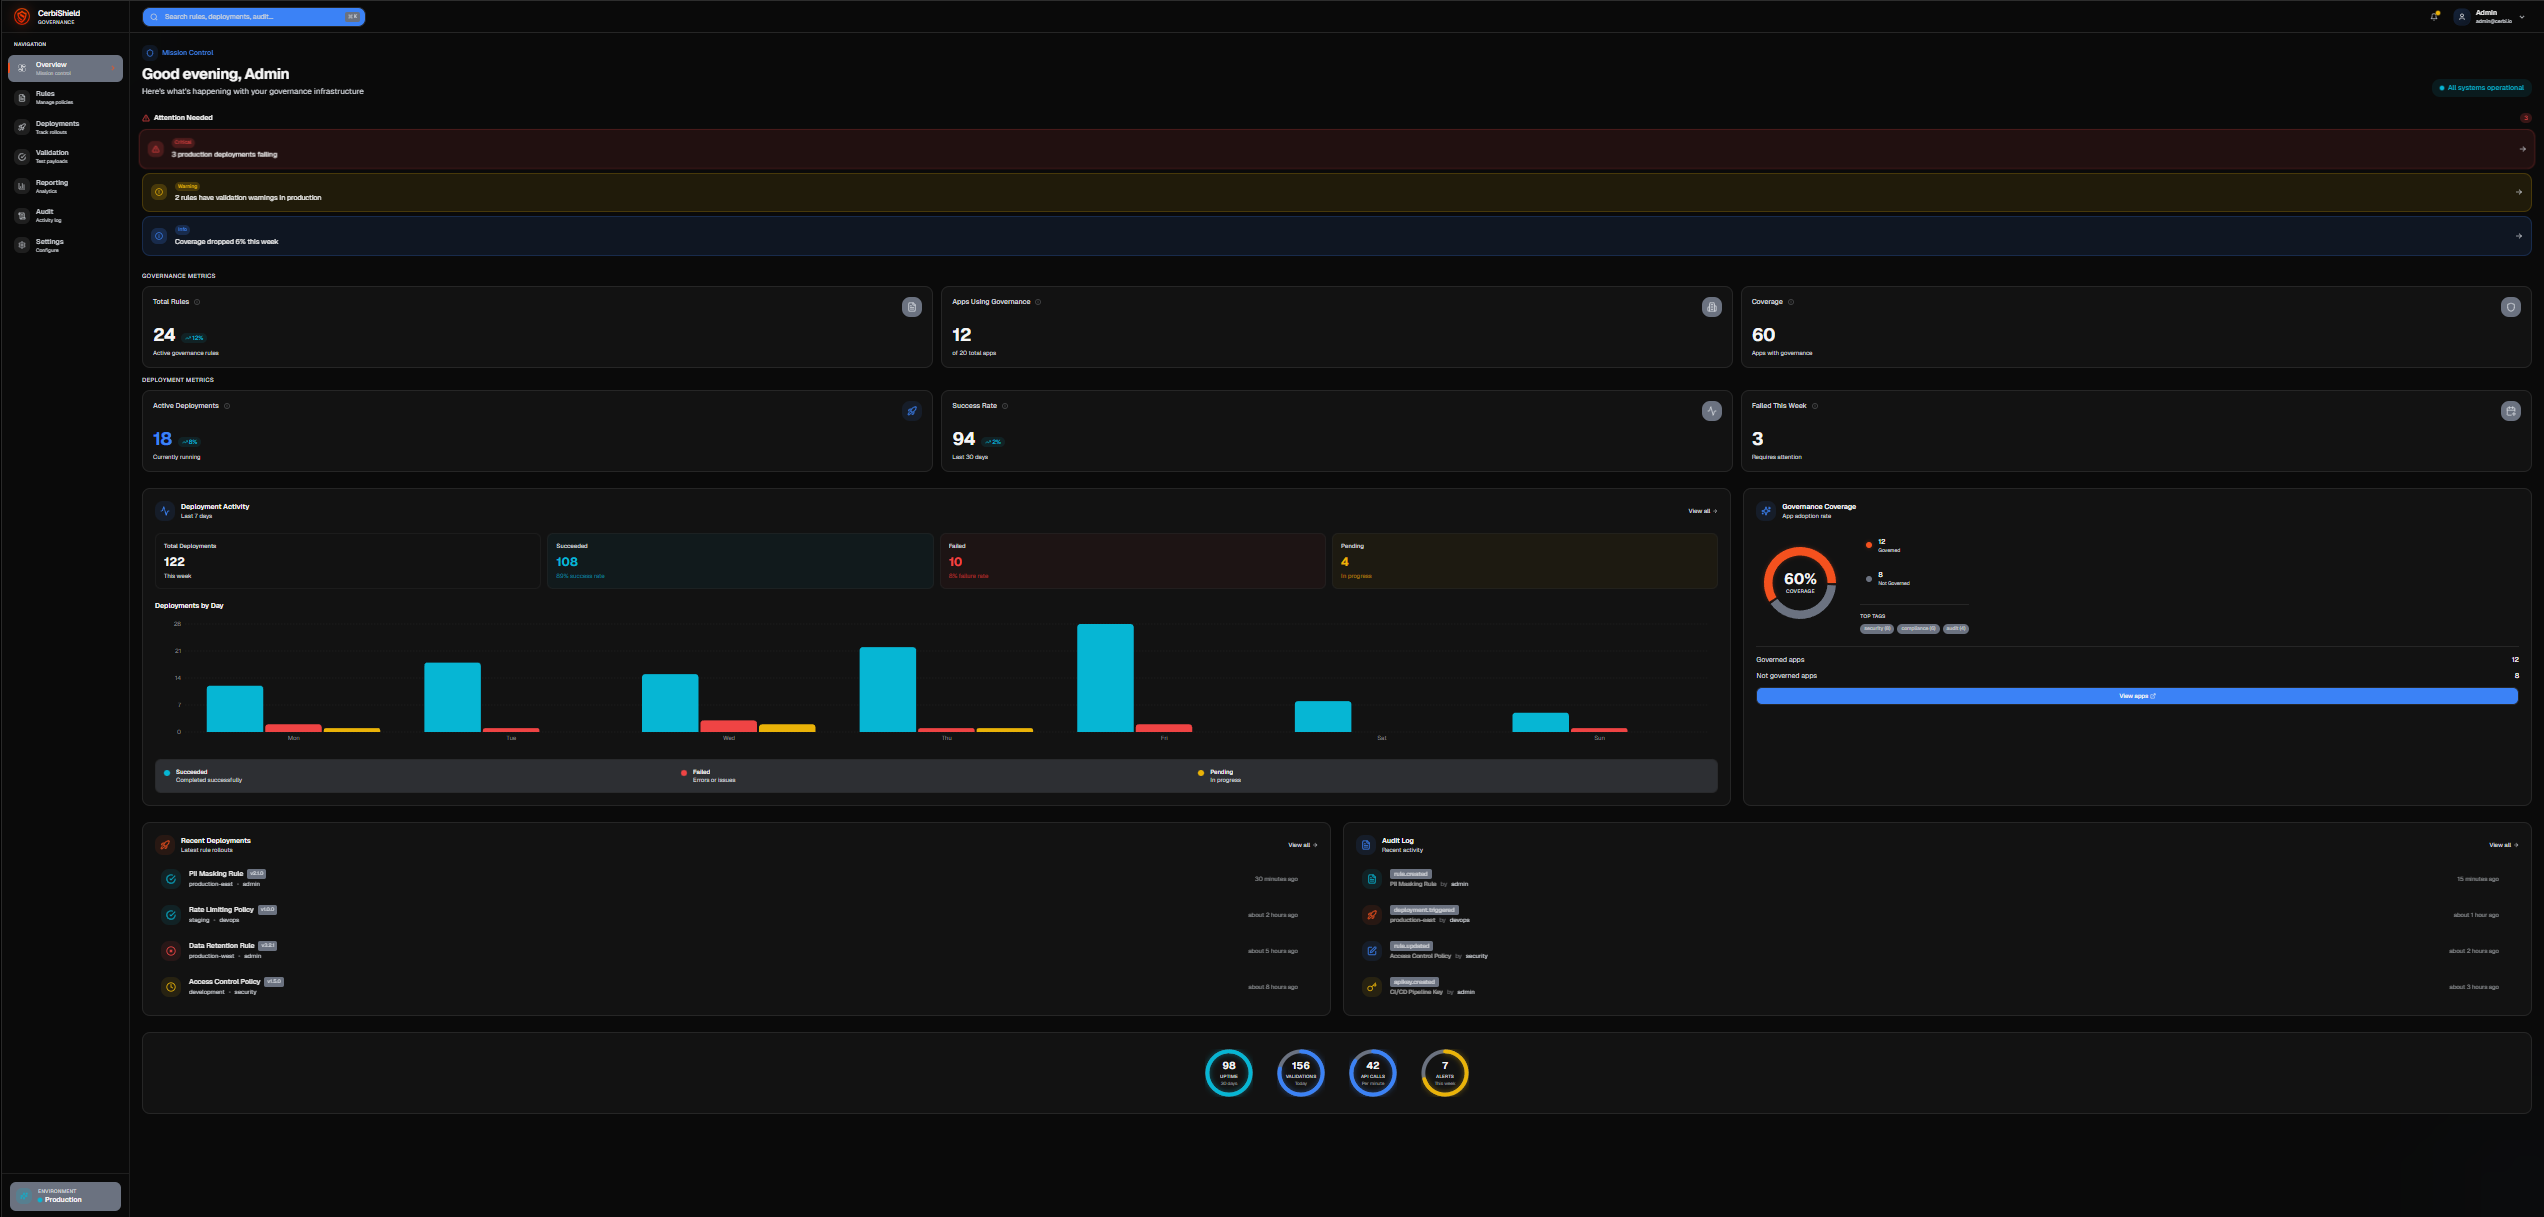
Overview
A real-time command center for governance health across all environments and services. Monitor your governance score, track violation trends over time, view severity distribution, and surface issues that need immediate attention.
- Real-time governance score
- Violation trend visualization
- Severity distribution breakdown
- Platform health indicators
- Attention alerts for critical issues
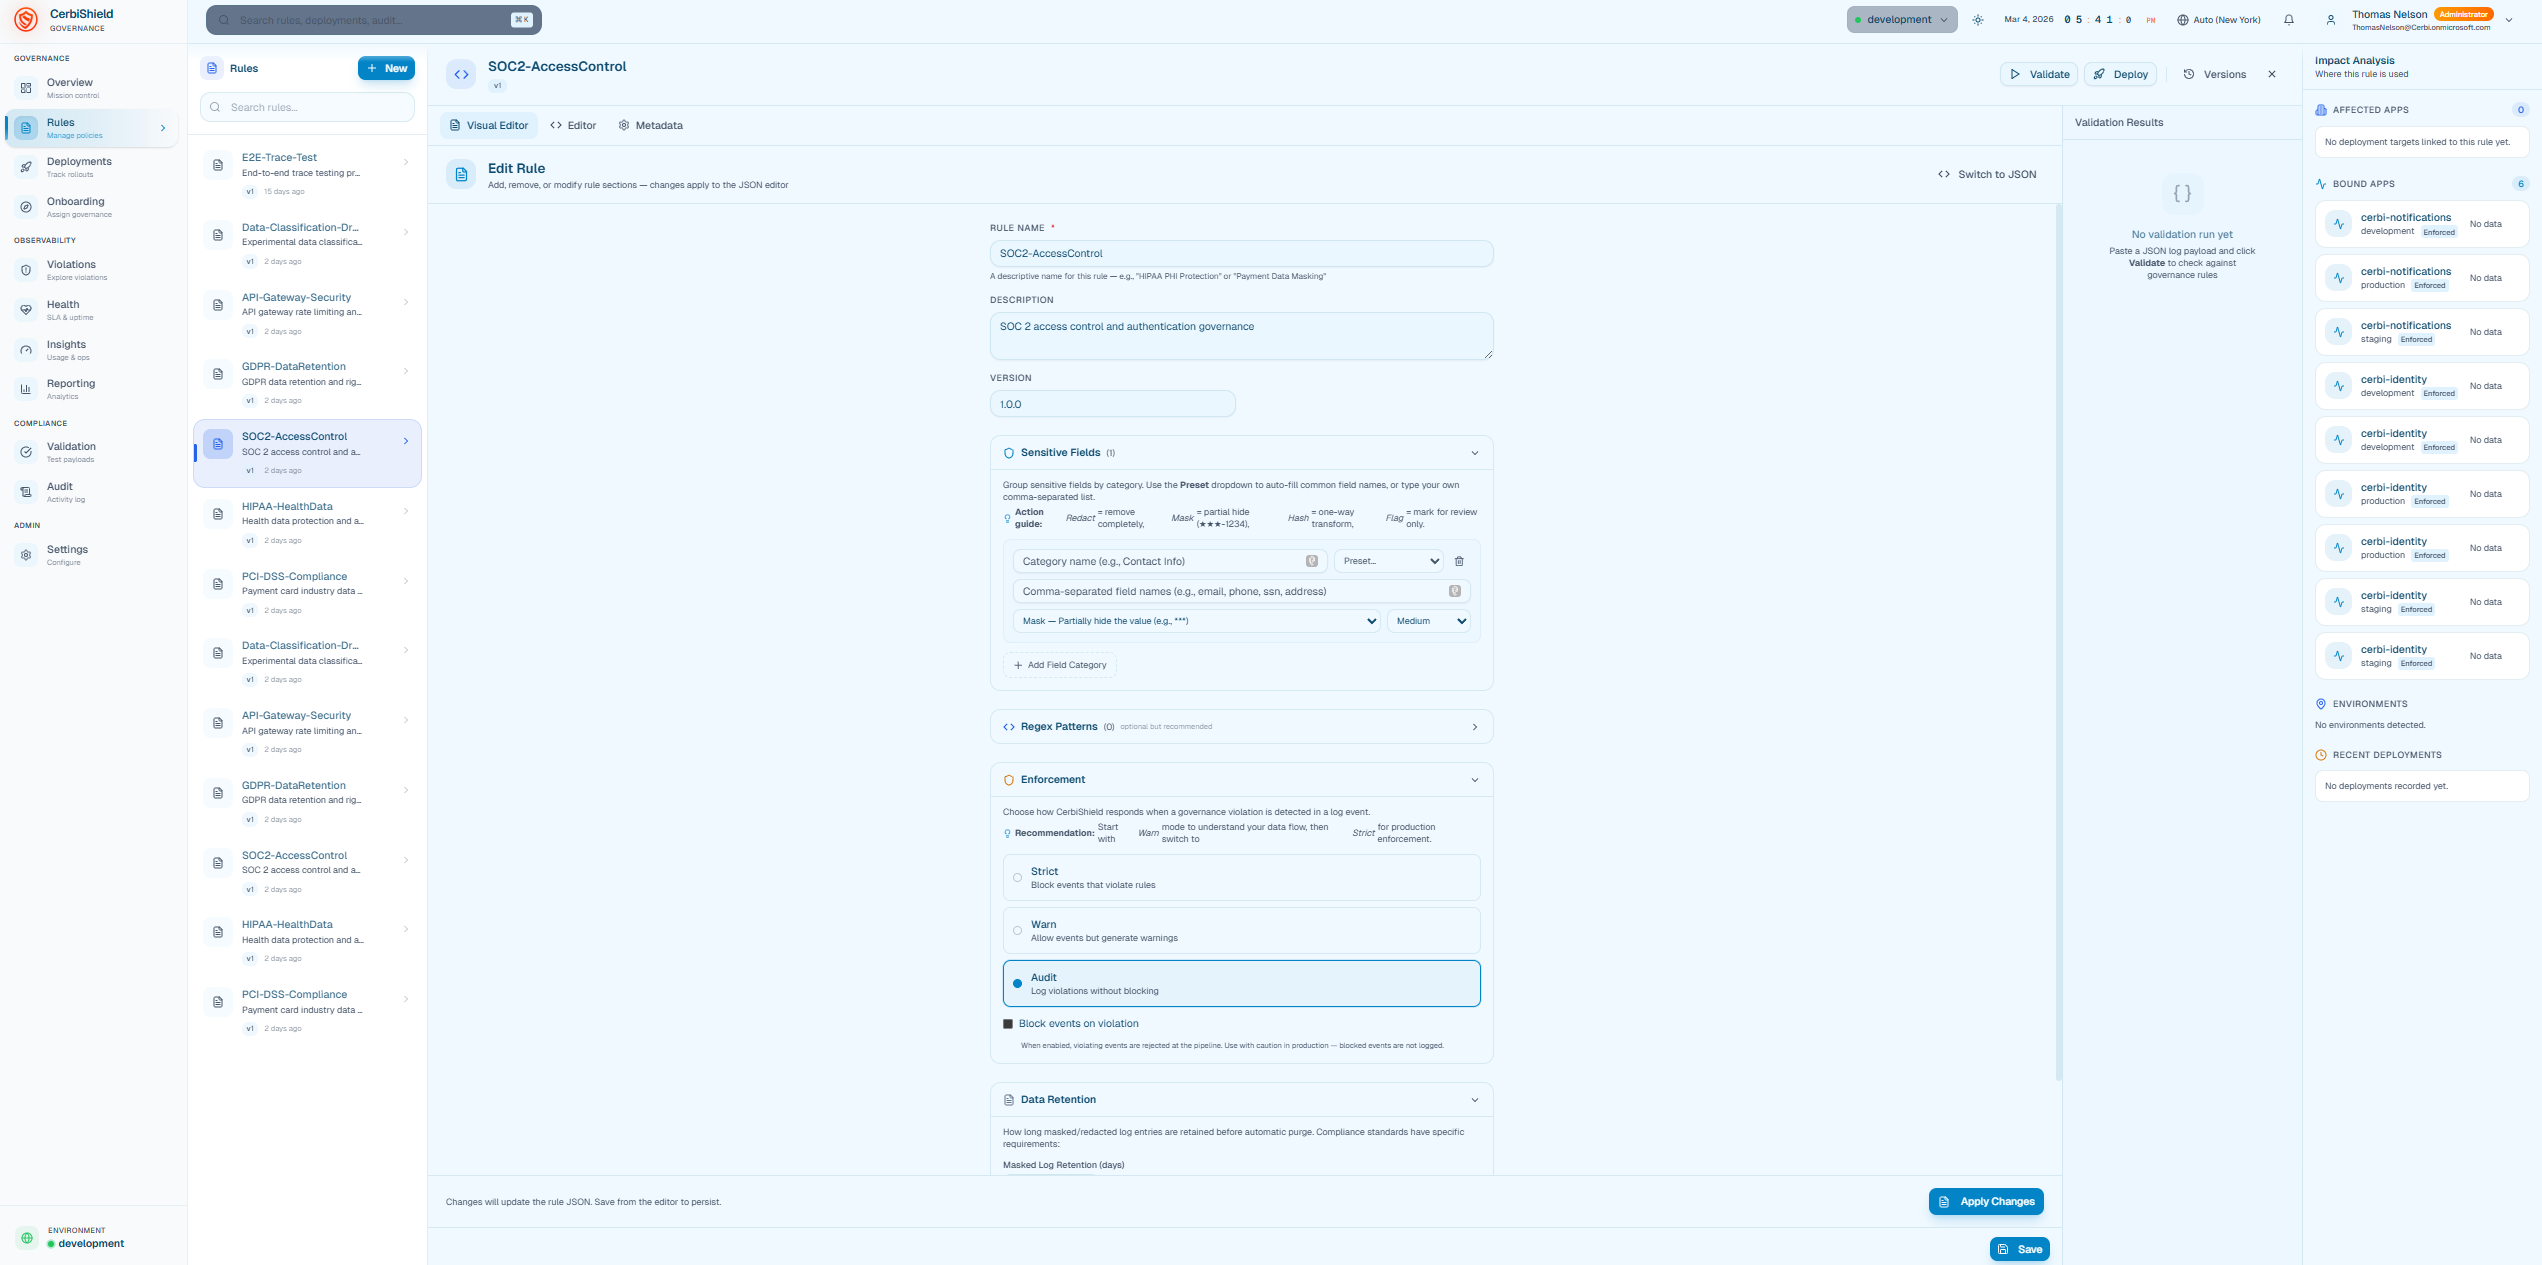
Rules Editor
Define and manage governance policies through both visual and JSON interfaces. Configure required fields, forbidden patterns, sensitive data categories, and enforcement modes. Real-time impact analysis shows which applications will be affected before deployment.
- Visual and JSON rule editing
- Sensitive field categorization
- Enforcement modes - Strict, Warn, Audit
- Real-time impact analysis
- Application binding preview
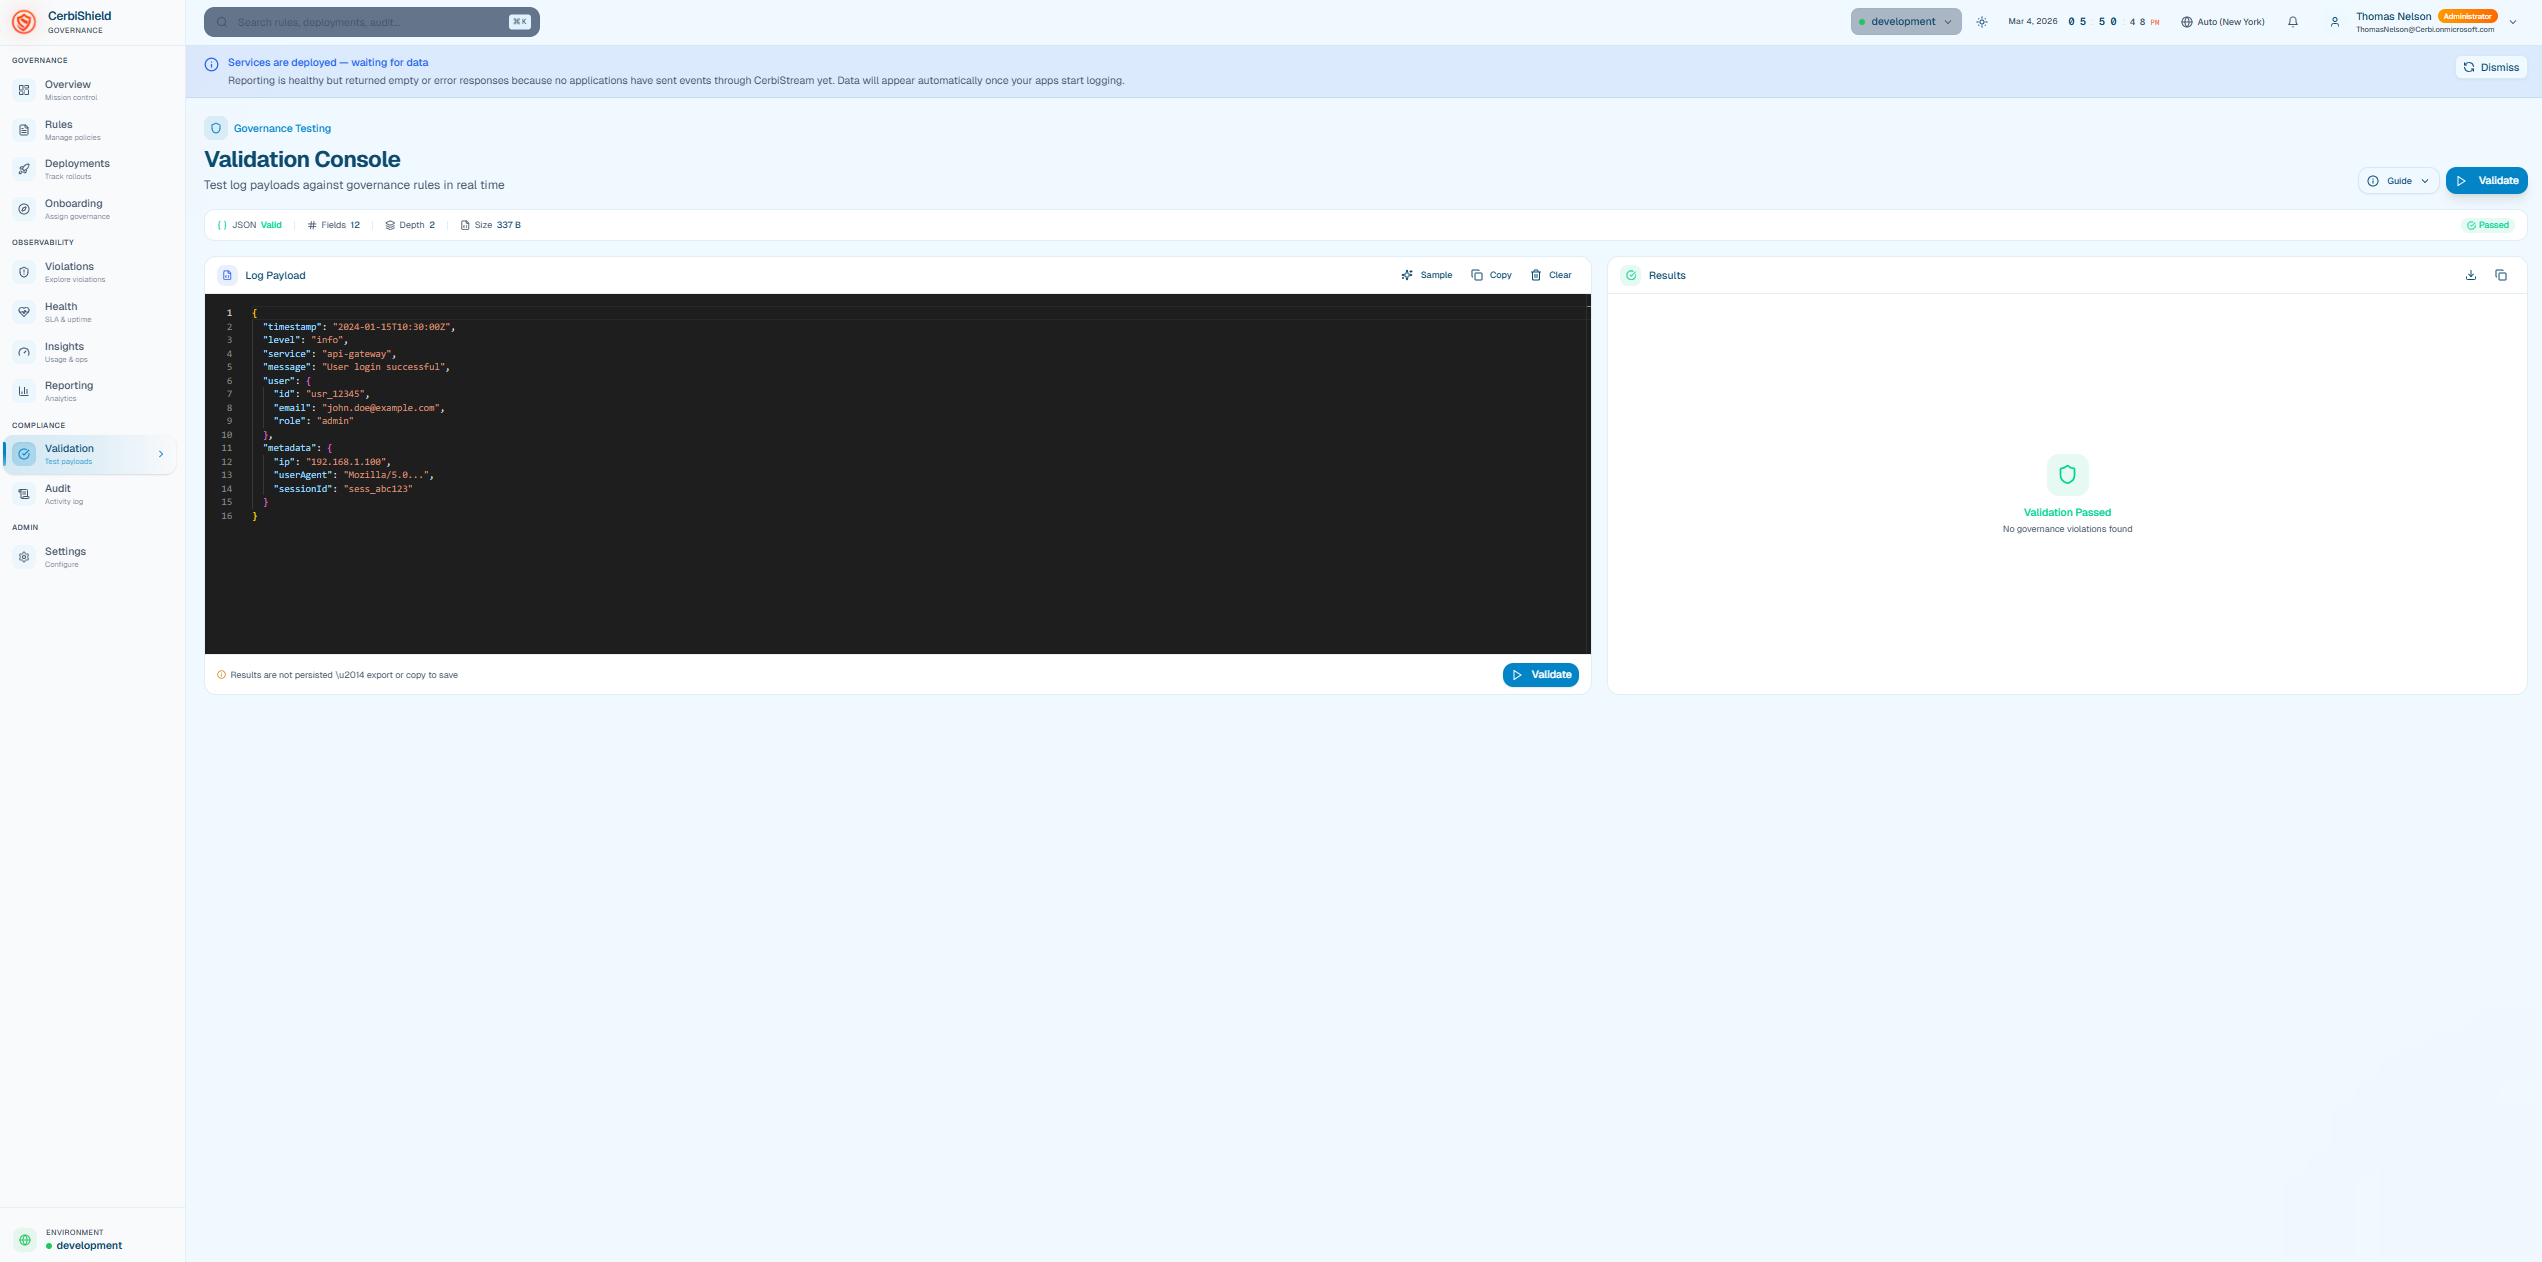
Validation Console
Paste or load sample JSON payloads, validate instantly against your governance rules, and see field-level violation details. This sandbox ensures rules work as expected before they reach production.
- JSON payload editor
- Live validation against active rules
- Field-level violation details
- Sample payload library
- Pre-deployment testing
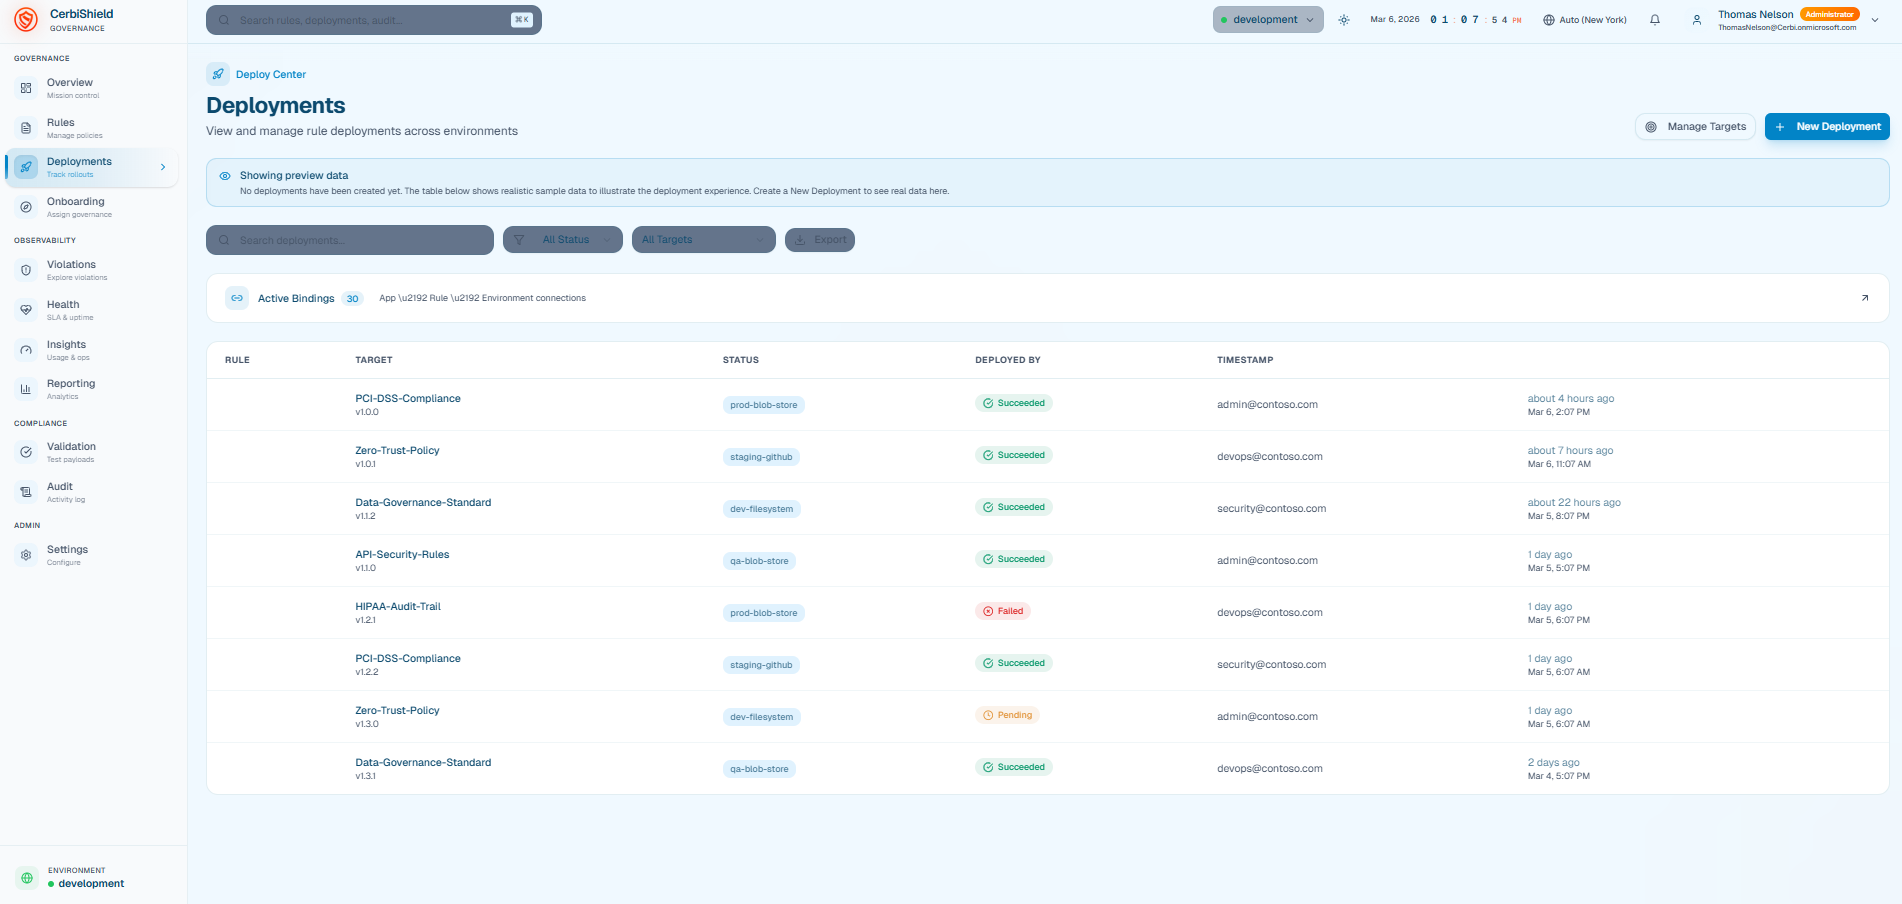
Deploy Center
Full visibility into governance rule deployments across all environments. Track active bindings, monitor deployment status per target, see who triggered each rollout with timestamps, and initiate new deployments with confidence.
- Active binding overview
- Per-environment deployment status
- Deployment history and audit trail
- One-click new deployments
- Rollback capability
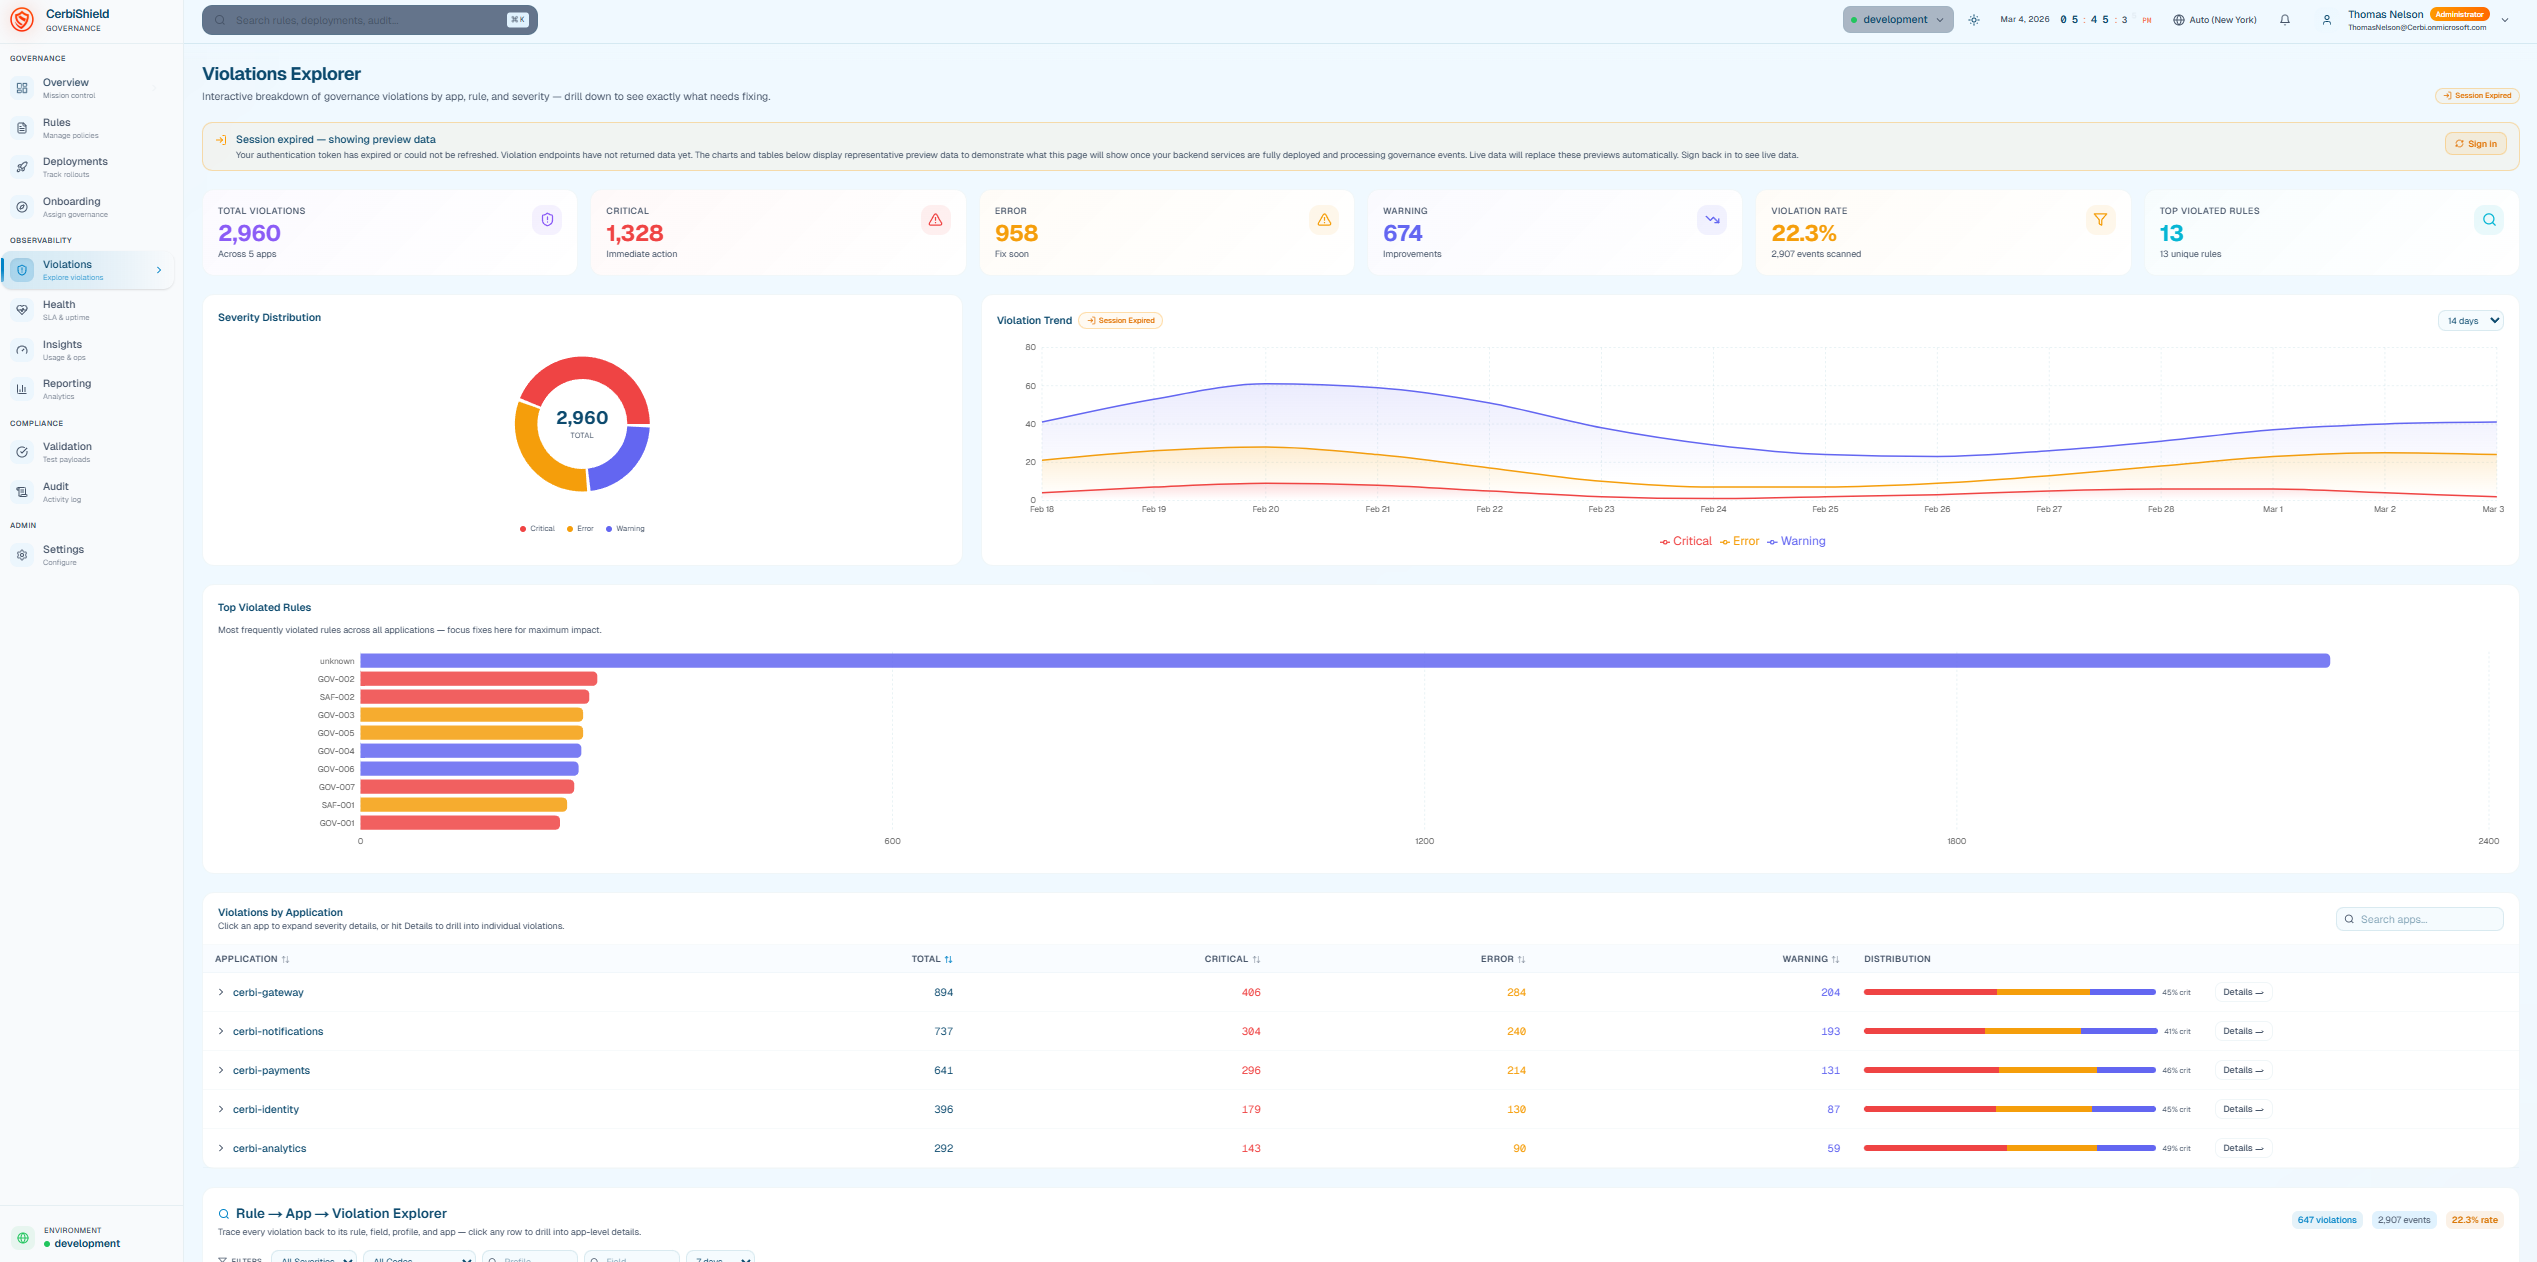
Violations Explorer
Drill down from high-level severity distribution through trend analysis to individual log events. Filter by application, rule, environment, and time range to focus remediation where it matters most.
- Severity distribution visualization
- Violation trend analysis
- Application-level drill-down
- Rule-based filtering
- Individual event inspection
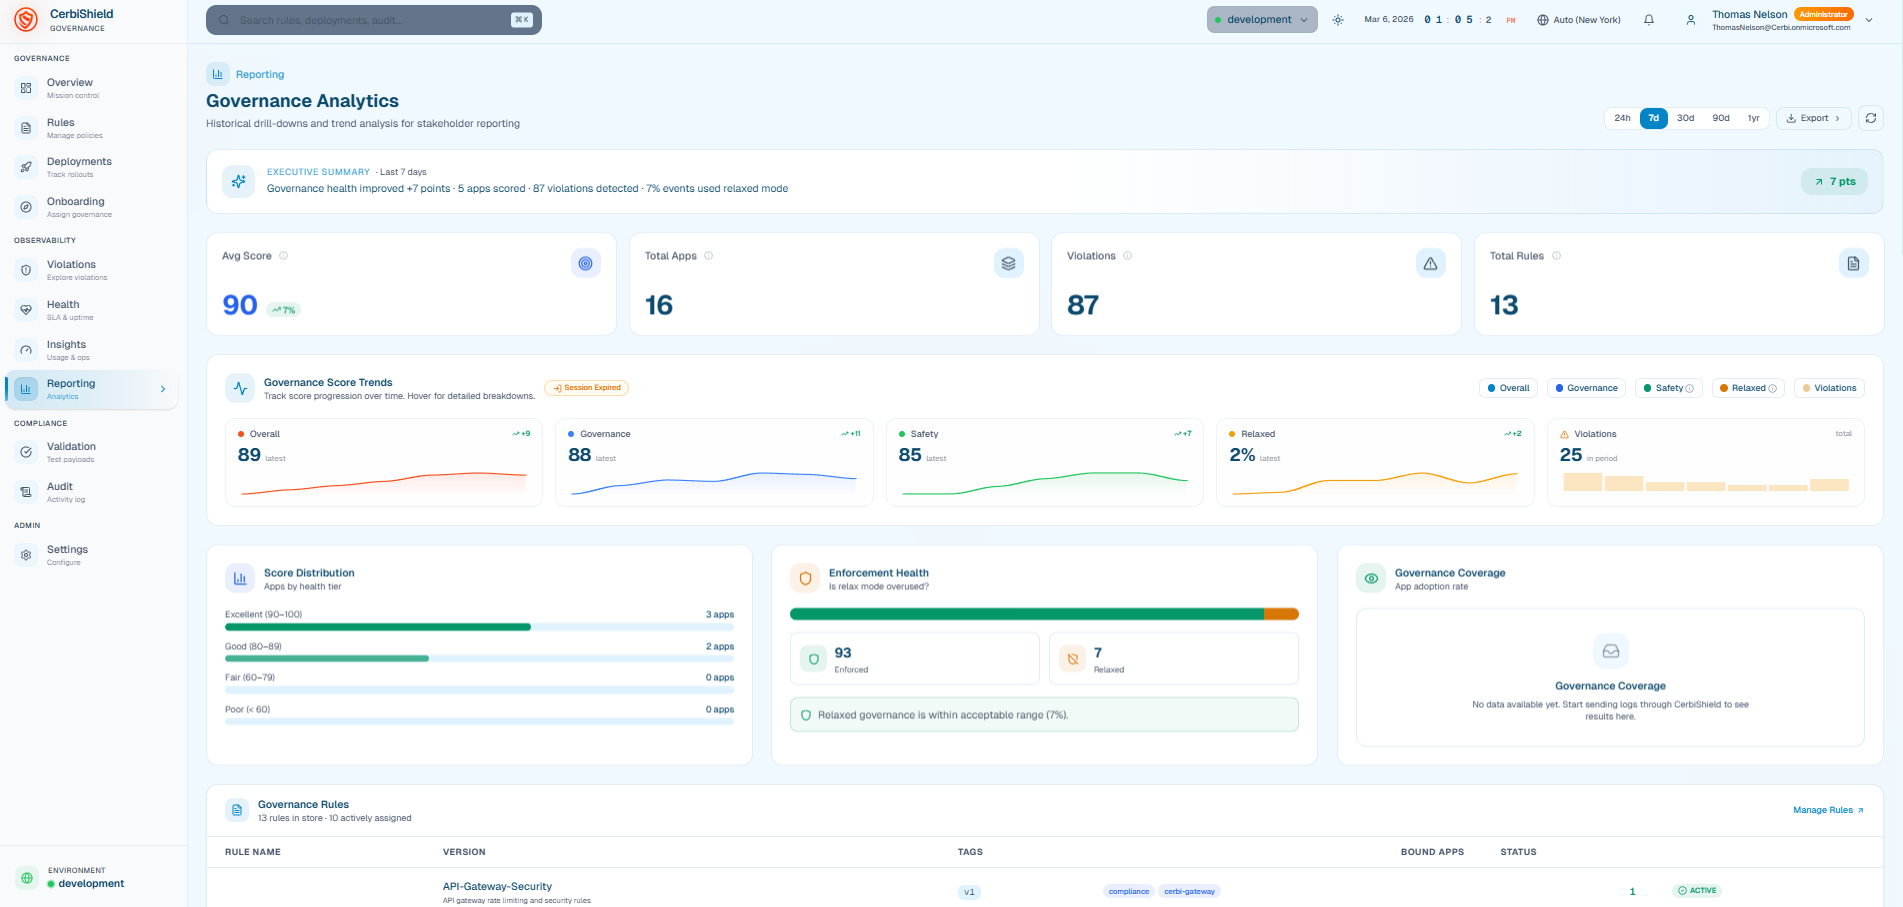
Governance Analytics
Track governance score progression over time, monitor enforcement health, analyze score distribution across applications, and measure coverage rates. Export reports for audits and compliance reviews.
- Governance score trends
- Enforcement health metrics
- Score distribution analysis
- Coverage rate tracking
- Export for audits
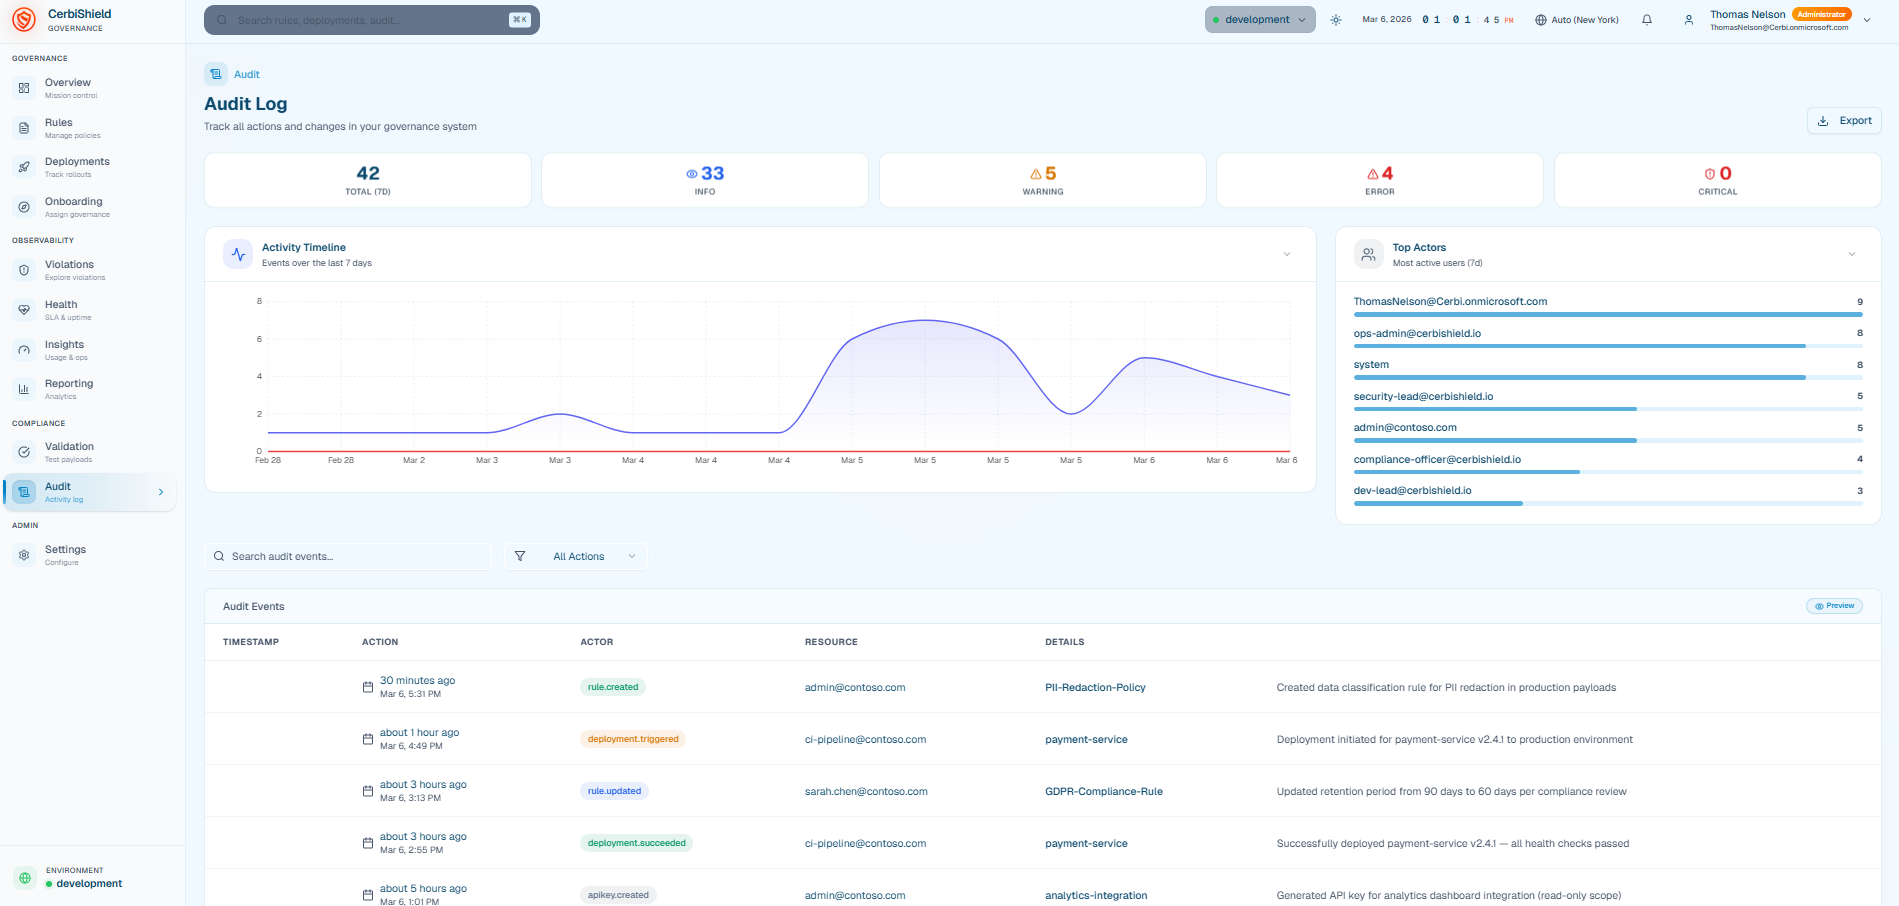
Audit History
A complete immutable log of every governance system action. Filter by action type, search by actor or resource, view the activity timeline, and identify top contributors. One-click export supports compliance review.
- Immutable activity timeline
- Action type filtering
- Actor and resource search
- Top actor identification
- Compliance export
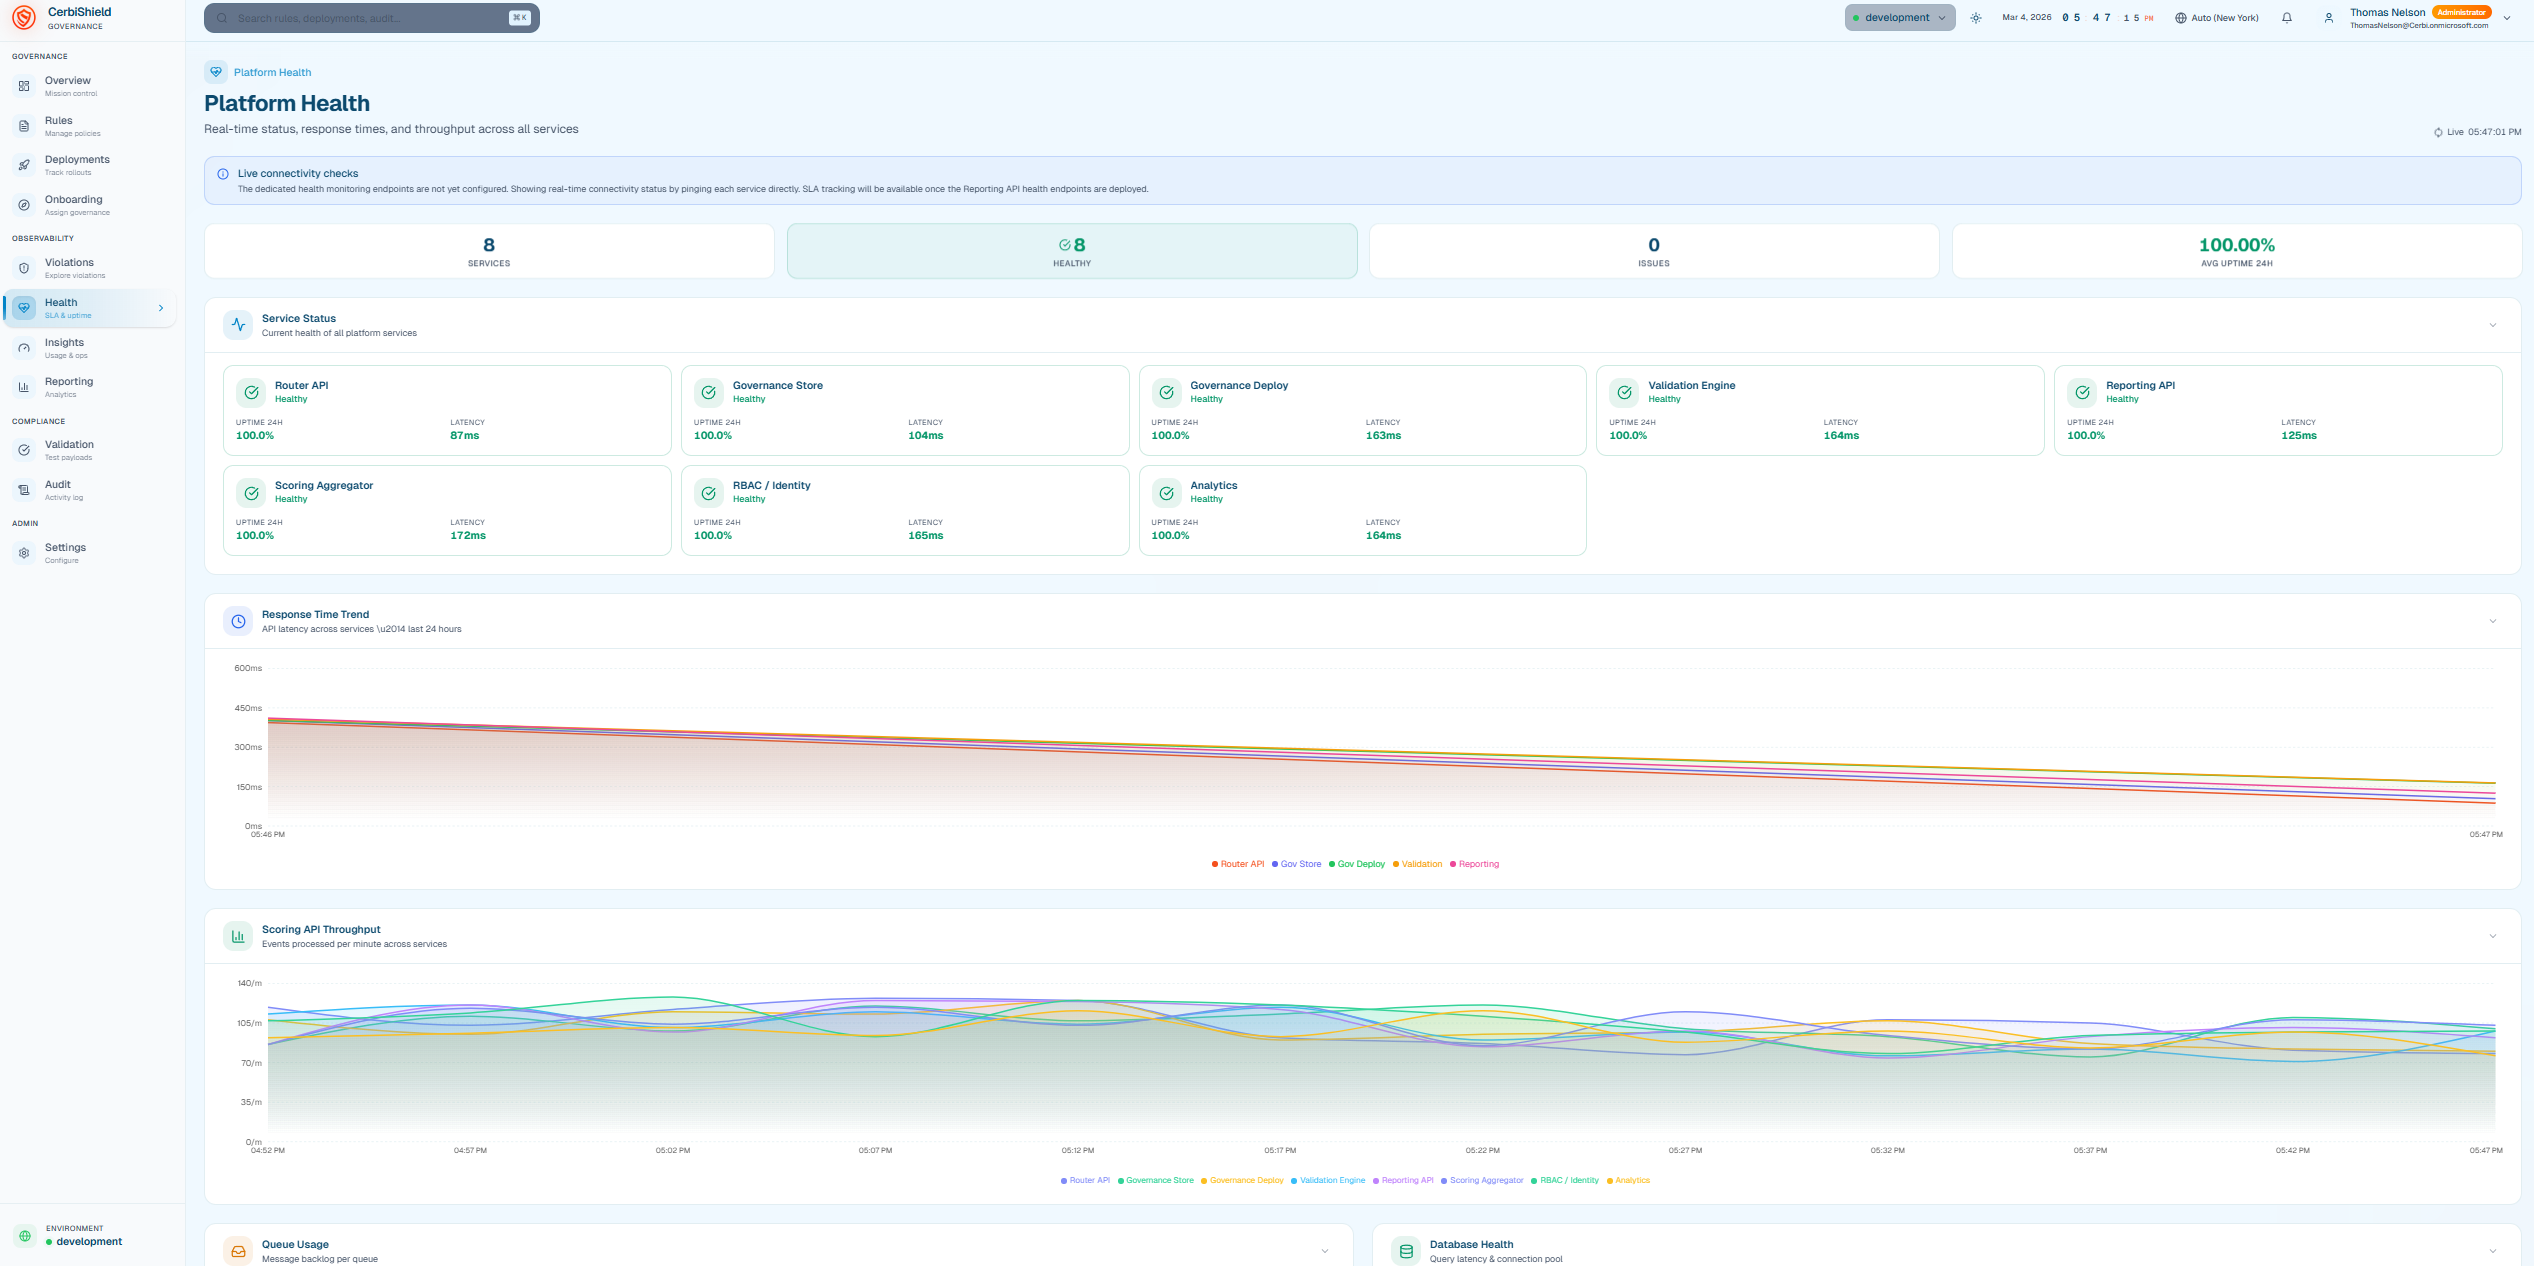
Platform Health
Real-time visibility into governance infrastructure. Monitor uptime, latency, and throughput across all CerbiShield services including Router API, Governance Store, Validation Engine, and more.
- Service uptime monitoring
- Response time trends
- Throughput metrics
- Queue health indicators
- SLA compliance tracking
Governance belongs in the pipeline, not the postmortem.
Talk to an architect about deploying CerbiShield within your environment.